Blog

“Small Data” is Becoming a Potentially Bigger Problem

“There are three kinds of lies: lies, damned lies, and statistics.” – Unknown

What do you see when you react to the following chart from American Funds?

american-funds-active-1

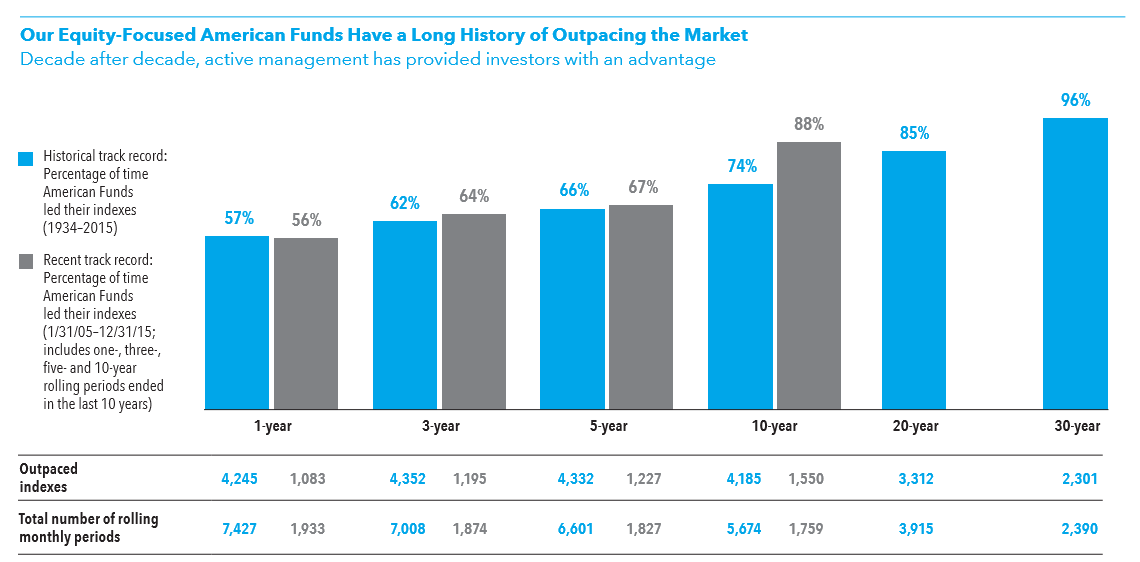
At first glance the title and bar charts do their jobs. The likely reaction from most readers is probably along the lines of it looks like the majority of American Funds’ mutual funds have done a good job beating their indexes. Point made.

But, someone (like me) might linger on the chart for a few extra seconds, leading some questions to come to mind:

  • What are “equity-focused” funds? Is the data set not just pure equity funds?
  • Is the data gross or net of fees? If gross, how does that impact the results?
  • Why is the “recent” track record defined as 10 years?

Here’s one more example that leads off a different American Funds piece supporting active management:

american-funds-active-2

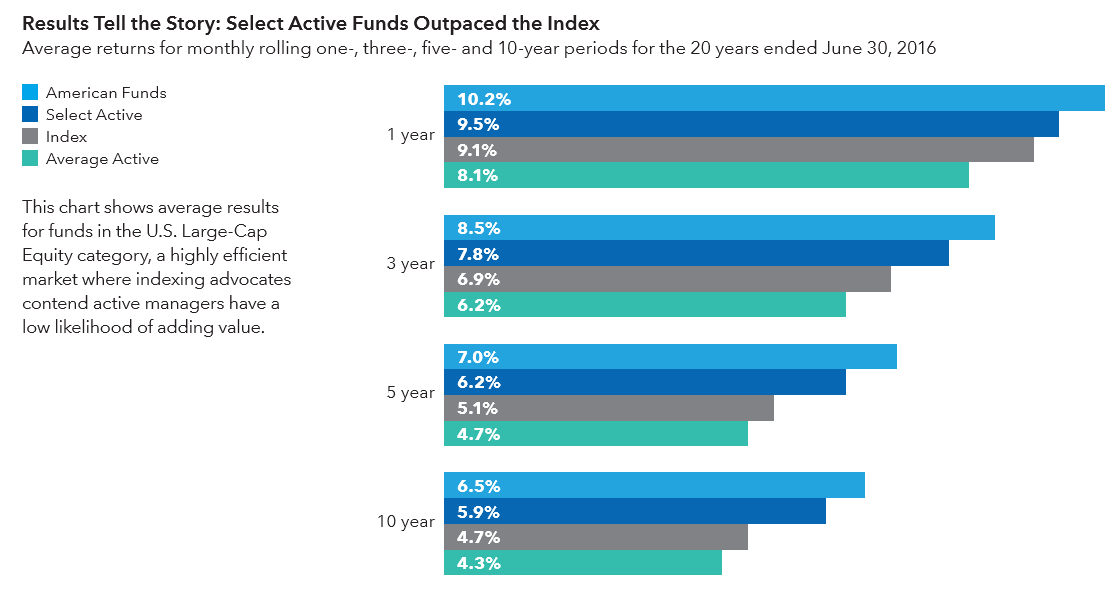
Again, a cursory look gives a clear initial takeaway. A bit more consideration, however, can trigger a few more questions:

  • How were the specific thresholds for defining “Select Active” funds determined?
  • Is the data gross or net of fees? (Yes, this question is essentially ubiquitous.)
  • Why is only US Large Cap Equity included? How does the data vary for other categories?

These questions are the result of what I’ll call the industry’s “small data” issue. Small data is the information that asset managers use to support their ideas and research. It is the ever-present backbone of the countless arguments making the cases for asset classes, factors, specific mutual funds, and more.

The problem with small data is two-fold:

  1. The parameters and decision-making processes surrounding it are often unclear, even if someone willingly roots around the disclosures.
  2. There is no uniformity in the construction and use of small data between firms or even within a single firm.

Limited consistency and transparency on the context, definition, and presentation of small data can foster questions and skepticism. I (unscientifically) wonder if firms are unintentionally making it easier for people to doubt what they see or view such data as wholly self-serving, especially given people’s general distrust of marketing messages.

Despite the burden of disclosure, the use of small data makes me think firms might benefit from a more overt approach to communicating the context around the data they present. Clear, prominent, and consistent presentation of the key parameters and rationale for a data set may both reduce potential skepticism of that data and earn firms implicit credit for being up-front with clients.
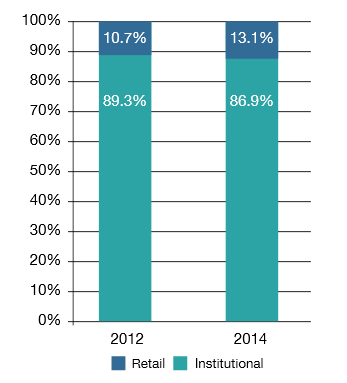
ESG Study

Two Current Marketing Gaps for ESG

The ESG market is purportedly massive ($59 trillion globally with $6.5B in the US alone). Primarily these assets are held by institutional investors and predominantly in Europe.SRI Assets SRI Assets 2 ChannelsA conventional theory about why ESG hasn’t broken through in the US retail channel states FAs and HNW investors perceive a performance gap versus traditional products. For instance, a 2016 TIAA survey notes over 50% of FAs and investors expect a lower rate of return. However, significant academic research exists dispelling the notion that ESG products have lower rates of return. In a Deutsche Bank examination of academic studies, 89% show highly-rated ESG companies outperform the market. And more recent studies show the performance perception may be changing.

So what’s an asset management marketer looking to communicate its product lineup to do? For firms that have viable products and a desire to promote them, I see two approaches to begin materially-influencing US retail buying behavior.

Address Implementation

The “how” in terms of integrating ESG is often missing in firms’ messaging. There is an opportunity to answer straightforward questions like is ESG a full replacement of all my non-ESG strategies? Is it better to start in one asset class? If so, which one and why?

BlackRock provides a “Practioner’s Perspective (PDF)” that I’d consider only suitable for certain institutional investors and then a glossary of basic terms on their blog. Natixis provides a trio of views on ESG but doesn’t answer these or similar questions. Deutsche Bank shares highly technical implementation via smart beta in their 2013 paper, “SRI Integration via Smart Beta.” These examples don’t really support FAs that may consider integrating ESG into client portfolios.

Provide Examples

Showcasing practical hypothetical examples of how ESG can benefit a portfolio by improving returns and/or reducing risk while positively impacting the broader world enhances clients’ understanding. In essence, consider case studies. A case study can address performance bias or risk considerations or issues such as reducing firearmsaccess (USSIF data shows over $350B in policies restricting investments in weapons manufacturing).

These approaches provide showcase whitespace in ESG marketing that may support FAs integrating ESG strategies.

[1] – Top two charts via GSIA (PDF)

3 Practices to Improve Your Firm’s Blog Posts

For the last five years, I’ve tracked the industry’s blog posts and seen tremendous growth. Growth in number of firms, frequency of posts, and quality per post. In the quality dimension, many aspects of individual posts taken for granted now were absent five years ago. For example, these four details were not commonplace:

Authors’ names (many posts were published by “admin” or “asset manager”)

Charts, graphs and data tables (many posts were 500+ words of straight text)

Links to related thought leadership

A clear conclusion

QualityFrom reading hundreds of industry blog posts, I want to share three favorite practices.

  1. Include a “Bottom line.” Too many times, authors post 500+ word entries without a highlighted point of view or logical next step. A bottom line reiterates a single idea to take away.
  2. Add only relevant and simple charts. Many posts include unnecessarily complex charts. Each week, I come across a chart with multiple vertical axes, and data in both line and bar chart form. If the post’s point is so complex it requires such a difficult chart, perhaps a whitepaper is a better format.
  3. Use a precise question as the title. Of the three, this practice is changing the most quickly in 2016. Still, we see posts titled “Q2 Bond Update” or “Views from Asia.” Titles like this often undersell the quality within. Title-as-question is not preferred for all posts, yet many posts could benefit from this format.

I imagine in 5 years’ time these will be commonplace across the industry.

Best Blogs of the Week #247

Two posts this week featuring investing timeliness from industry titans.

BlackRock – Bonds that have seen the most traffic lately – The first thing that jumps out at me from this Bloomberg data is the continued search for yield.

Vanguard – When the worst of times is the best of times  – To help you explain the challenges of timing the market to clients, we looked at the 20 worst and 20 best days from 1990 through 2015. What we found (see figure below) is that all but one of the worst days were within a month of at least one extreme up day.


Timeliness - Vanguard


Best Blogs of the Week #246

Three posts this week to consider, including an interesting retirement income approach via Vanguard.

Hollie Retirement IncomeBlackRockHow investment advisors are changing with the times – How investment advisors are changing with the times – Last year, almost 20% of the surveyed viewed robo advice as a threat to their businesses, while 39% saw robo technology as an opportunity. This year’s study was significantly more optimistic: Only 14% saw robos as a threat, while nearly half saw them as an opportunity.

Chip Retirement IncomeVanguardChanges to Form 5500: Lessons from the life of a beta fish  – Benchmarking often leads to plan design enhancements that improve participant retirement outcomes. Of course, transparency into any individual plan could also produce an entirely different outcome. For example, the proposal indicates that the IRS and DOL could use the Form 5500 data for targeted enforcement of plans with compliance issues noted on the form. It wouldn’t be surprising for these plans to be subject to future audits.

Colleen Retirement IncomeVanguardSustaining retirement income in a lower-return world – Two of the most popular are the “dollar plus inflation” and the “percentage of portfolio” rules. I’d like to offer what I consider an alternate solution: the “dynamic spending” strategy.